Oura & Garmin:
Do the Numbers Tell the Full Story?
The Stack
I run an Oura Ring Gen 4 and a Garmin Epix Pro Gen 2. Both feed into a private dashboard I built called SITREP. It pulls the raw data from each device, deduplicates the workouts, and runs a multi-metric anomaly detector across the combined feed. Everything you'll see below comes out of that pipeline. I'm not sponsored. I bought these because I wanted answers about what my brain is doing while I sleep, train, and recover.
The two devices don't overlap as much as you'd think. Oura owns the night: overnight HRV (validated against ECG in peer-reviewed studies), sleep staging, body temperature deviation, breathing regularity, cardiovascular age, SpO2. Oura Advisor, an AI coach with full access to your biometric history, sits on top of all of that and translates the data into plain-English answers. Garmin owns the workout: GPS, real-time pace and power, training load, training readiness, body battery, VO2 max for running and cycling separately. The Morning Report is the at-a-glance synthesis when you wake up. Run them together and you get the most complete picture either company can produce.
Methodology Note: Wear Schedule
One important honest disclosure up front: Oura is 24/7. Garmin is roughly 16 hours per day. I take the Epix Pro Gen 2 off at night (G-Shock to bed) because the Garmin (and the original Instinct before it) gives me contact dermatitis when worn around the clock. I haven't had that issue with Coros Apex 2, Coros Nomad, or Apple Watch Gen 4. If symptoms flare during the day, it comes off then too until they settle. So the sleep, overnight HRV, and body temperature data in this article is Oura-only. Garmin contributes the daytime picture: activity, structured workouts, GPS-tracked sessions, training load. That's a real limitation if you wanted an apples-to-apples sleep comparison; it's not what this article is.
I pulled seven months of data, October 2025 through April 2026. 195 days of overnight scores. 506 logged workouts. Three multi-metric anomalies the system flagged automatically. Not one of the three was caused by training.
Why Accuracy Isn't the Point
For a long time, I was hung up on whether these sensors were actually accurate. Is the ring as good as a hospital heart monitor? Is the watch really tracking my sleep stages or just guessing? I read the studies. I worried about the numbers. And after a while, I realized I was asking the wrong question.
Here's the thing. It doesn't really matter if the ring is off by a little, as long as it's off by the same amount every night. My body is the test subject. The same finger, the same ring, the same bed, every night for seven months. So the number on the screen isn't what I'm watching. What I'm watching is how it changes. If my HRV usually shows 55 and one morning it shows 40, something's going on. It doesn't matter if the "real" number is 60 or 50. The drop is the signal. For TBI recovery especially, I'm not comparing myself to population averages. I'm comparing this week to last week. The sensor just needs to be consistent.
Where the Numbers Nail It
Trend Direction
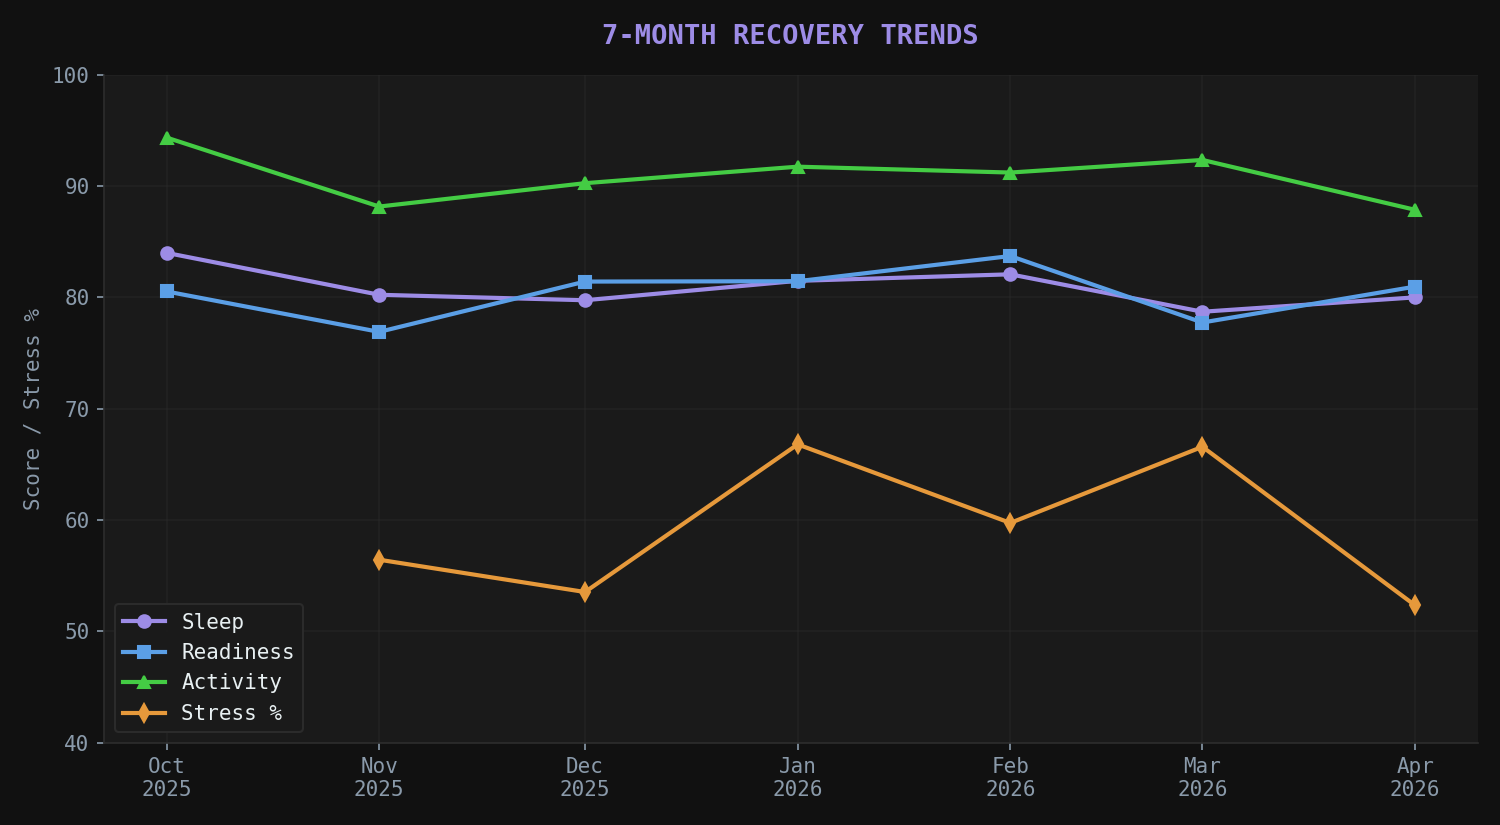
The best thing wearables do is show you which direction things are heading over weeks and months. Any single daily score is noise. Zoom out to monthly averages and you can see the body's actual state.
| Month | Sleep | Readiness | Activity | Stress % | Workouts |
|---|---|---|---|---|---|
| Oct 2025 | 84.0 | 80.5 | 94.4 | — | 40 |
| Nov 2025 | 80.2 | 76.9 | 88.2 | 56.4 | 28 |
| Dec 2025 | 79.7 | 81.4 | 90.3 | 53.5 | 76 |
| Jan 2026 | 81.5 | 81.5 | 91.7 | 66.8 | 54 |
| Feb 2026 | 82.1 | 83.7 | 91.2 | 59.7 | 77 |
| Mar 2026 | 78.7 | 77.7 | 92.3 | 66.6 | 98 |
| Apr 2026 | 79.8 | 81.0 | 87.1 | 52.9 | 103 |
Two stress spikes (January, March). One sleep crash (March). One impressive month (April: highest workout volume of the year, lowest stress, recovered readiness). At the daily level none of this would be visible. The noise would swallow it. The monthly averages tell the actual story.
Anomaly Detection Across Devices
SITREP's anomaly detector flagged exactly three multi-metric deviations in seven months. Each one was real. Each one mattered. None were caused by training.
- Nov 18, 2025. Body temperature deviation +1.52°C, sleep score 55, readiness 45. Cause: illness. Oura's overnight temp sensor caught the fever before I knew I was sick.
- Jan 1, 2026. Stress z-score +2.66 (the highest single-day deviation in the entire dataset). Cause: life, not training. Workouts that month were the lowest of the period (54 sessions, training load 494 vs. December's 689). The ring saw something the training data couldn't explain.
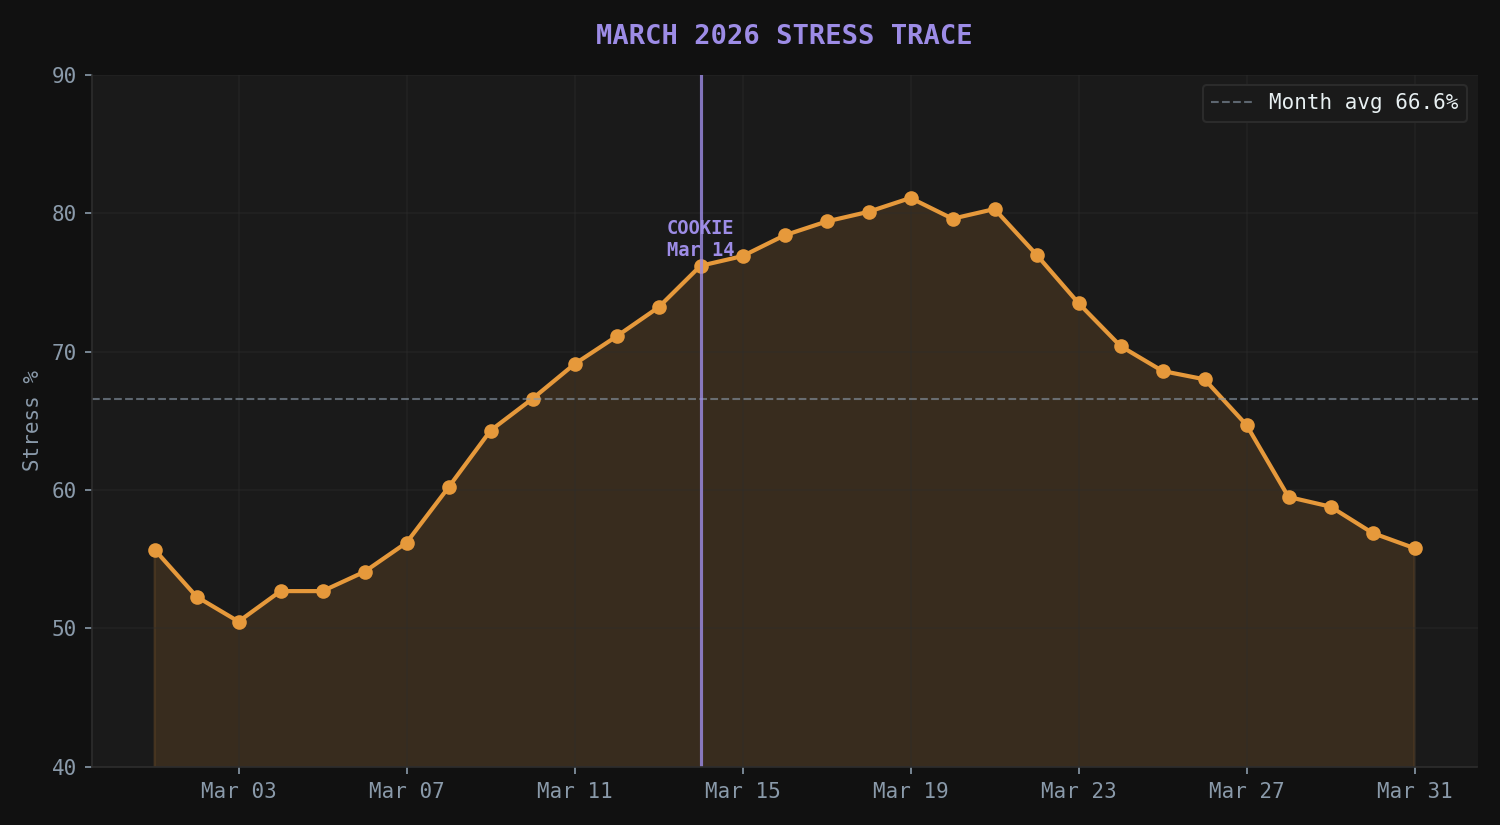
- Mar 15, 2026. Sleep z-score -3.05, readiness crash. Cause: grief. We lost Cookie, our husky, March 14. The wearables caught the dip the next morning. They could not read the cause.
That's the real value of multi-device monitoring. The device sees the deviation. You read the cause. When Oura flags a temp spike alongside a sleep crash, that's an illness signature. When stress spikes without training load, that's life. When everything drops on a single morning, something happened. The numbers don't tell you which. They tell you to go look.
Sleep Architecture
Quick caveat: Oura is solid at detecting sleep vs. wake (~90% accurate in independent studies). Stage detection (deep, REM, light) is less reliable, around 79% agreement with lab tests in Oura's own research, and it tends to overestimate deep sleep. The stage numbers aren't gospel, but they're useful as trends. "I slept poorly" is too vague to act on. "My deep sleep has been down for two weeks while REM held steady" is a place to start looking.
| Month | Deep | REM | Efficiency | Latency | Restfulness |
|---|---|---|---|---|---|
| Oct 2025 | 91.7 | 86.7 | 90.4 | 80.9 | 67.5 |
| Nov 2025 | 78.0 | 82.2 | 86.1 | 77.1 | 65.1 |
| Dec 2025 | 74.0 | 79.8 | 92.5 | 81.5 | 72.1 |
| Jan 2026 | 80.7 | 80.2 | 93.4 | 82.4 | 73.4 |
| Feb 2026 | 83.3 | 80.3 | 92.7 | 84.2 | 69.4 |
| Mar 2026 | 77.9 | 76.3 | 91.2 | 81.5 | 73.4 |
| Apr 2026 | 83.3 | 78.5 | 92.8 | 80.3 | 70.5 |
For TBI athletes, this matters. Sleep is one of the most stubborn things brain injury breaks. Knowing which phase is struggling tells you what to fix, and the breakdown above shows that deep sleep and REM moved together while restfulness drifted on its own. That's a clue worth chasing.
Reading the Right Score
It's tempting to read a single high score and conclude you're fine. The Activity score, in particular, gets a lot of attention. It's the most visible "how was your day" number. But Activity is a movement metric. It measures calories, steps, training frequency, sedentary time. It was never built to measure recovery, and Oura doesn't claim it does.
The score that does measure recovery is Readiness. And Readiness did its job.
| Month | Readiness | What was happening |
|---|---|---|
| Oct 2025 | 80.5 | Baseline |
| Nov 2025 | 76.9 | Illness mid-month (Nov 18 fever) |
| Dec 2025 | 81.4 | Recovered |
| Jan 2026 | 81.5 | Stress event at the sub-score level (Recovery Index dipped to 63.4) |
| Feb 2026 | 83.7 | Best month of the period |
| Mar 2026 | 77.7 | Cookie's death + recovery drop |
| Apr 2026 | 81.0 | Recovered, despite peak training volume |
Readiness moved when it was supposed to. November's drop signaled the illness. March's drop signaled the grief crash. The composite was doing what composites are designed to do. It pulls Sleep Score, HRV balance, body temperature deviation, recovery index, and activity balance into a single number that tells you whether to push or pull back. That's a working system doing its job.
Oura Advisor adds another layer entirely. It's a conversational AI coach, a large language model with direct access to your full biometric history. Since the June 2025 upgrade, Advisor can pull HRV trends, sleep stages, body temperature patterns, activity data, and tagged events (caffeine, alcohol, late meals, stressful days) into the same conversation. You can ask it specific questions in plain English. "Why was my HRV low this week?" or "what's been hurting my deep sleep?" It answers with analysis grounded in your actual data, not generic tips. It surfaces visual charts of your patterns, cross-references your habits against your recovery, and adjusts to either a supportive or direct tone depending on what you want.
It's not perfect. It's an LLM, so it can be wrong. It needs at least 14 nights of data to produce meaningful predictions. And the more specific your prompts, the better the answers. But it's a meaningful step beyond raw scores. it's actually translating the data, not just showing it back to you.
Garmin's free synthesis layer is the Morning Report, which bundles last night's sleep, training readiness, HRV status, and weather into a single glance when you wake up. Less conversational than Advisor, more glanceable. If you wear the watch overnight, it's a strong at-a-glance feature.
Garmin also offers Connect+ ($6.99/month) with Active Intelligence, their AI answer to Advisor. I haven't subscribed. Reception has been mixed, and my SITREP pipeline already covers the cross-metric analysis it's trying to sell.
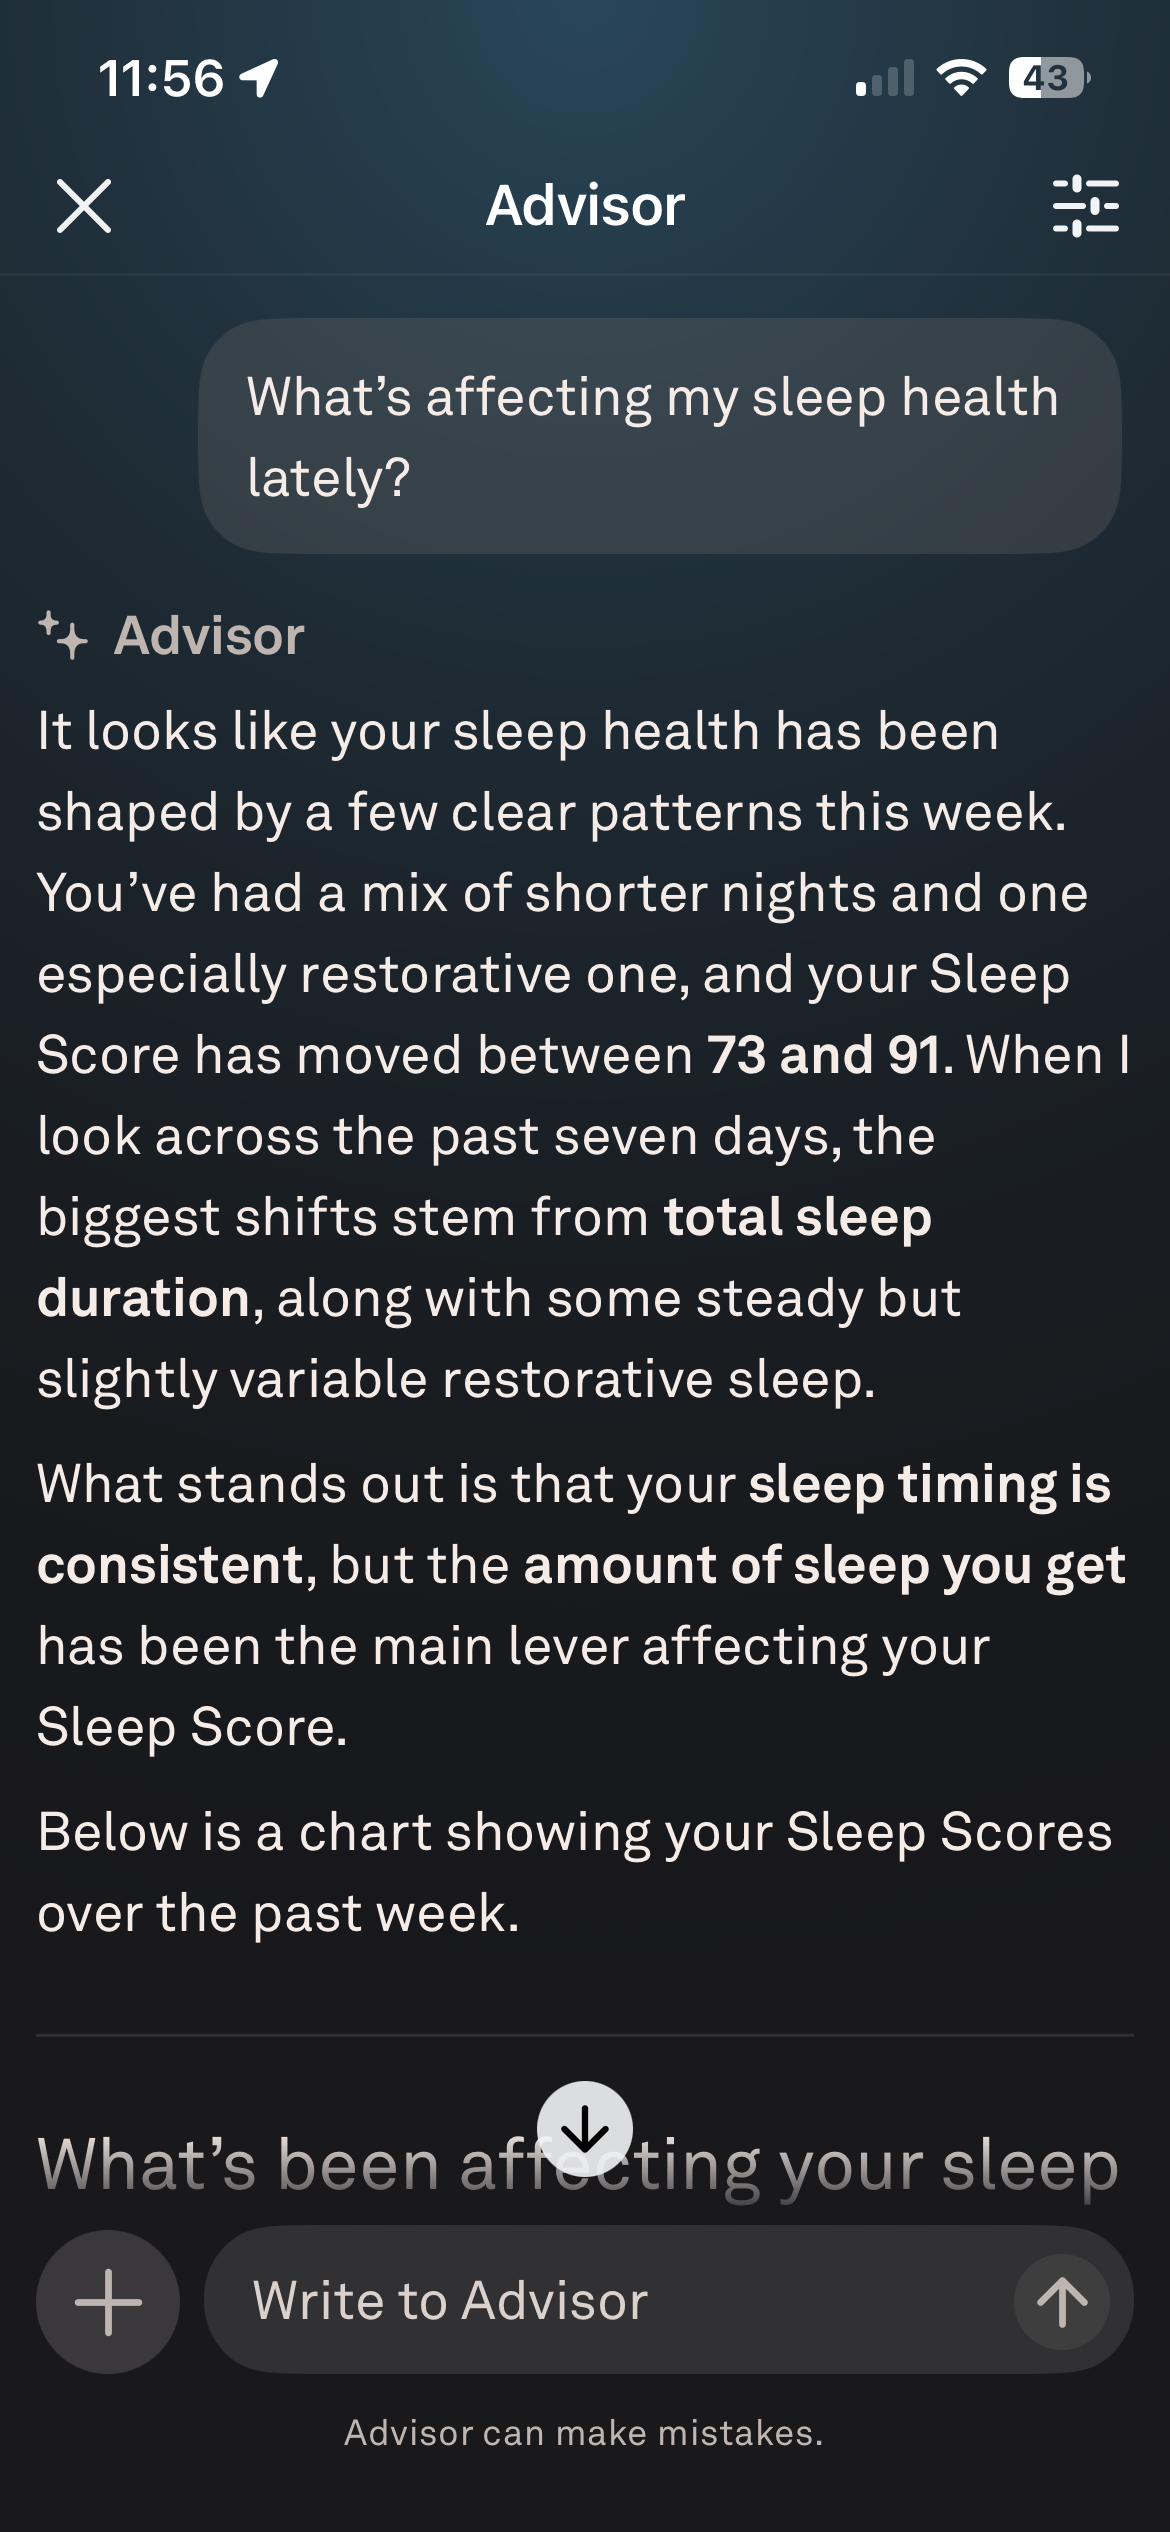
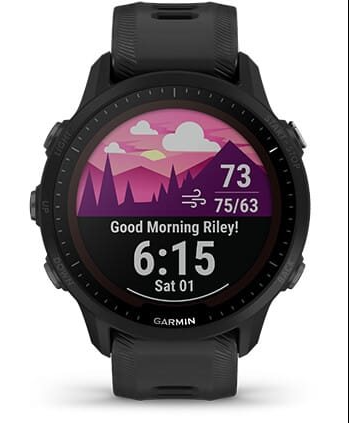
Both companies are genuinely trying to translate raw data into decisions. Oura's approach is more mature today. Garmin's may catch up. The honest question isn't whether they work. It's where they stop.
Tactical Note: November 18, 2025
Body temp deviation +1.52°C overnight. Sleep score 55. Readiness 45. The Oura ring caught a fever before I knew I was sick. The signal showed up overnight, hours before the symptoms did. That's the upside of always-on tracking. A sensor that doesn't sleep won't miss the moment your body starts fighting something. The ring did exactly what it should do. I just had to listen.
Keep reading the mission log
New intel every Sunday // No spam
Where the Devices Stop
Cognitive Load Is the Frontier
No wearable on the market measures brain fatigue directly. HRV estimates how your nervous system is doing. Resting heart rate tracks heart recovery. Sleep staging measures how well your body restores itself at night. Body temperature deviation flags illness. All of these are real, useful, and validated. None of them capture what a brain pushed too far actually feels like. The fog. The slow thinking. The light sensitivity. The feeling of running at 60% brain power despite a perfect Readiness score.
A healthy athlete with an HRV of 48ms is probably having a slightly off day. A TBI athlete with an HRV of 48ms might not be able to follow a conversation. The number is the same. The meaning is completely different. This isn't a flaw in the device. It's a frontier the technology hasn't crossed yet. Cognitive load measurement requires something more than what HRV and sleep staging can produce on their own.
Restfulness: A Signal Worth Watching
One sleep sub-score deserves a closer look: restfulness. Across seven months, restfulness has been pinned in the high 60s and low 70s while deep sleep climbed from 74 to 83 and REM moved between 76 and 87.
Oct 67.5 → Nov 65.1 → Dec 72.1 → Jan 73.4 → Feb 69.4 → Mar 73.4 → Apr 70.5.
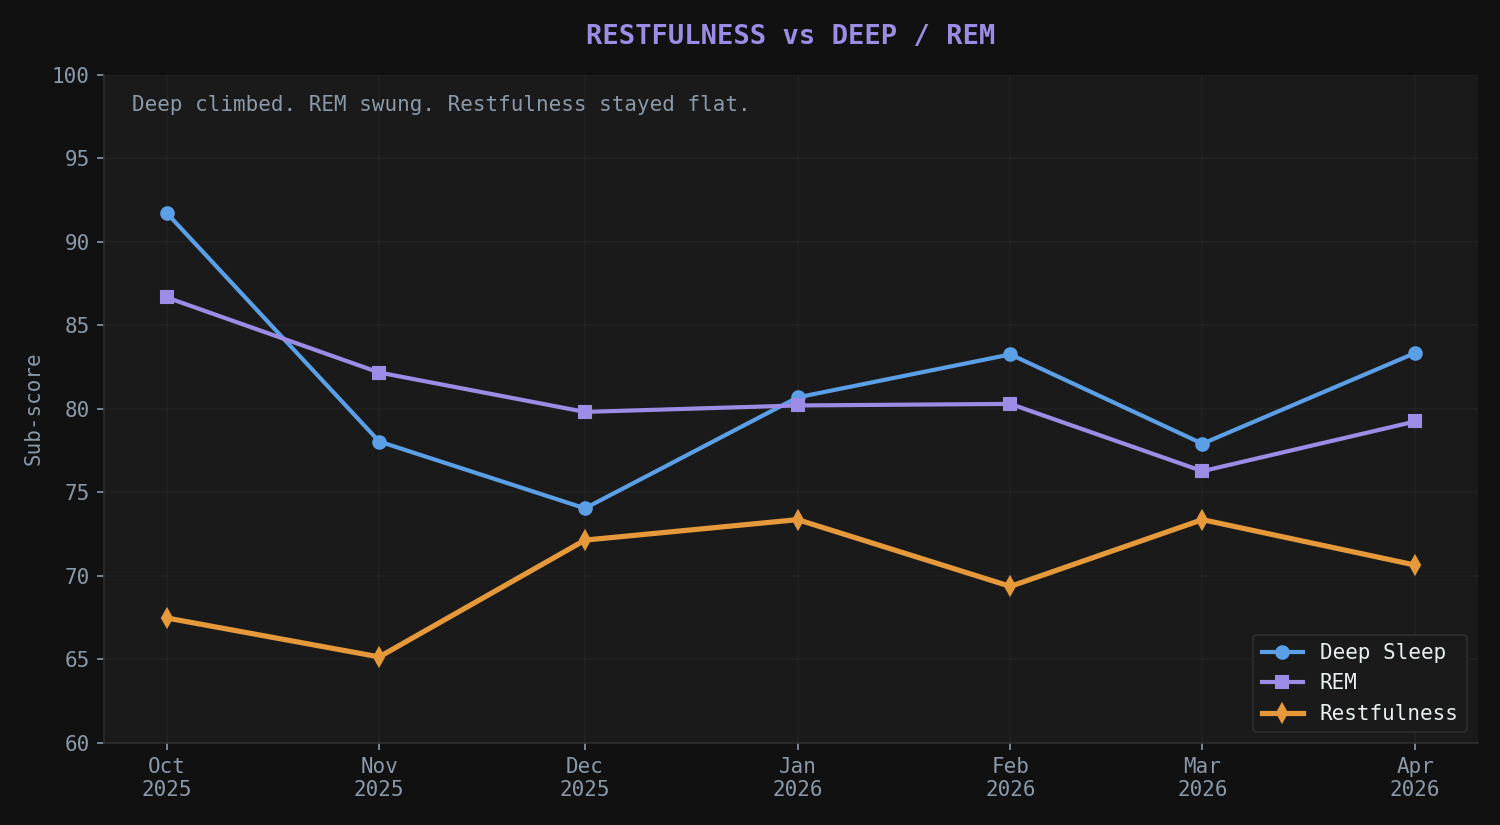
Restfulness factors into the Sleep Score and ultimately into Readiness, so it's not invisible. The system is accounting for it. But for TBI athletes, watching this single sub-score directly is worth the effort. It's measuring nighttime movement and sleep disruption, and the kind of broken, non-refreshing sleep that's common after brain injury seems to land here. When my other sleep numbers improve and restfulness doesn't, that's a signal my nervous system is still working through something the rest of the data is averaging over.
Each Device's Strengths and Gaps
Running only one device works if you know what you're giving up. Run both and the picture sharpens significantly.
- Oura on its own misses structured strength training. In January, the ring captured 49 of 54 workouts but didn't flag the strength sessions Garmin logged. Recovery scores were calculating against incomplete training data.
- In my specific setup, Garmin doesn't contribute overnight data because it comes off at night (~16 hrs/day wear due to dermatitis). That's a personal limitation, not a Garmin one. The Epix Pro Gen 2 does track sleep, HRV, and Pulse Ox overnight if you wear it. The Nov 18 fever signature came from Oura's body temperature deviation tracking, which is Oura's strongest single-feature differentiator regardless of which Garmin you pair it with.
The Missing Layer: Neuro-RPE
Standard RPE (Rate of Perceived Exertion) asks one question: how hard was that? Neuro-RPE asks two: how hard did your muscles work, and how hard did your brain work?
A healthy athlete squatting at 75% might report a muscular RPE of 6 and a neurological RPE of 3. The brain barely notices. A TBI athlete squatting the same weight might report a muscular RPE of 6 and a neurological RPE of 7. The muscles are fine, but the brain is redlining. Same barbell, same weight, totally different cost. The wearable gives you the body side. Neuro-RPE gives you the brain side.
April proved it. Workouts hit 103 sessions, the highest of the period. Training load averaged 1058. By every measure of volume, this should have been the month the wheels came off. Instead, recovery markers improved:
- Sleep score: 79.8 (up from March's 78.7, near the 7-month average)
- Readiness: 81.0 (up from 77.7)
- Stress %: 52.9, the lowest of the period
- Deep sleep: 83.3 (matched February's high)
- HRV balance: 74.4 (recovered from March's 72.3 dip)
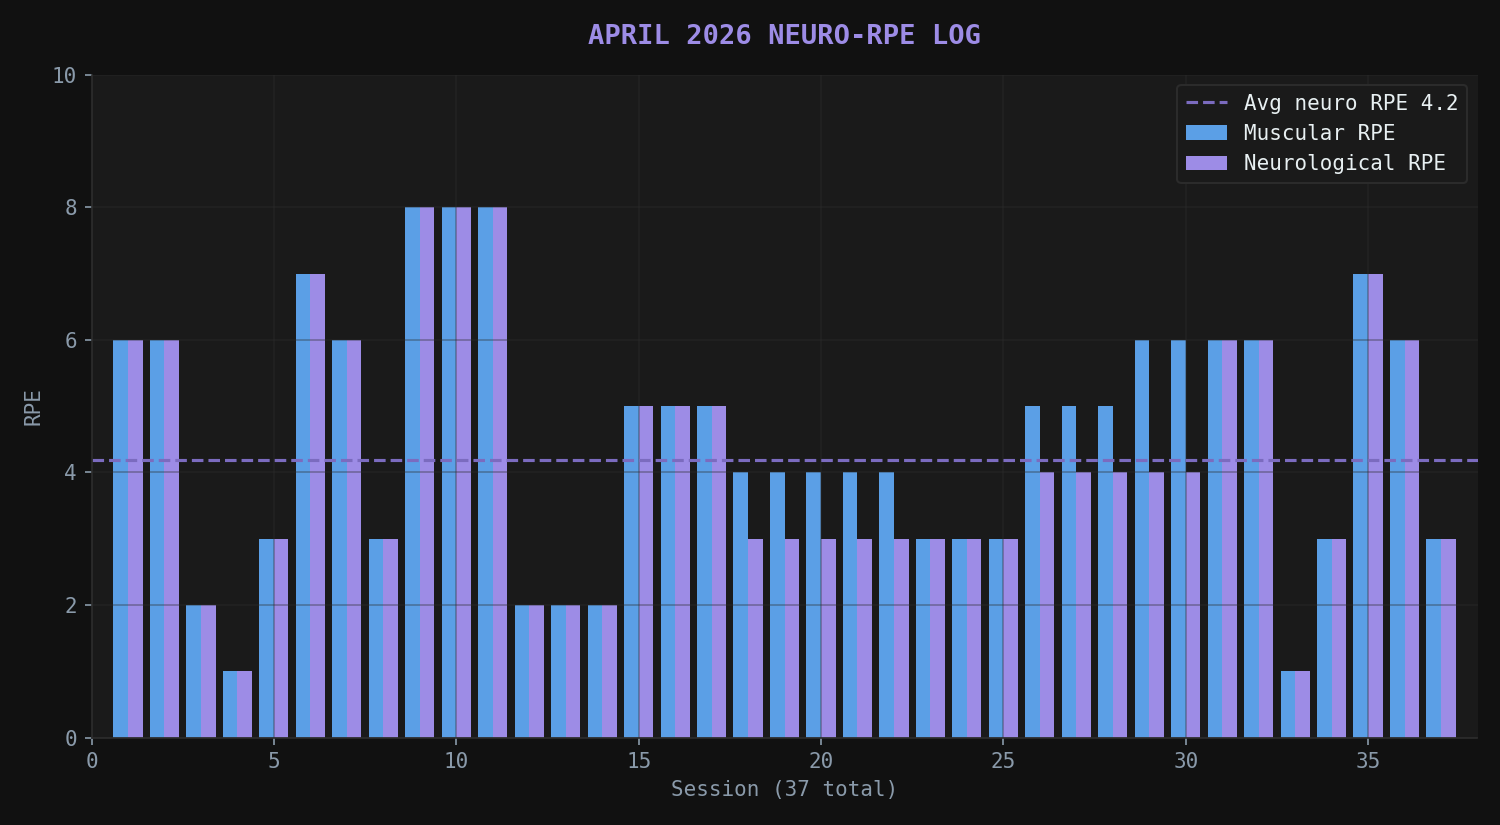
The difference between March and April wasn't volume. The difference was that Neuro-RPE was actively governing the sessions. 38 sessions logged with both muscular and neurological RPE, average neuro-RPE 4.3 (down from March's 5.8). The framework capped sessions before they crossed into brain-fatigue territory.
That's the finding the wearables alone could never produce: more training, less brain cost, better recovery. The body data confirmed it. The brain data drove it.
How I Actually Use the Stack
- Morning go/no-go. Oura Readiness, Sleep Score, and body temp set the baseline. If readiness is below 75, sleep below 70, or temp deviation above +0.5°C, the session gets scaled. Garmin's Body Battery adds a second read before training. The ring gets a vote, not a veto.
- Weekly trend check. Oura's 7-day HRV average is the real signal (daily is noise). Five consecutive down-days means something needs to change. Restfulness is the canary: when it drops, my nervous system is building debt even if the composite Sleep Score still looks fine. When something looks off, I ask Advisor directly.
- Training reconciliation. Garmin catches structured workouts Oura misses. SITREP merges the two feeds and dedupes so I'm not double-counting or calculating recovery against incomplete data.
- Neuro-RPE governance. Every session: muscular RPE and neurological RPE tracked separately. If neuro-RPE crosses the day's cap, the session is done. The barbell doesn't get a vote. 48 hours later, the brain check: if there's a cognitive hangover, intensity was too high, no matter what any ring says.
If I Had to Pick One
Having both is a luxury, and I don't take it for granted. Each tool earns its keep on a different side of the picture. Oura is stellar at recovery and weak at activity tracking. Garmin is the opposite, an athletic tracker I trust for workouts but not for the recovery read. There's also the practical side of Oura: I can't wear the ring while lifting, and I'm not interested in the silicon covers people buy to keep theirs from getting scratched.
But if I had to choose one moving forward, specifically for TBI recovery, the Oura wins.
Here's why. The Oura's "weakness" at gym tracking (poor heart rate during lifts, no awareness of sets, reps, or RPE) doesn't actually matter for recovery science. Your body reacts differently to a hard session than an easy one. The ring doesn't need to understand the workout. It just needs to read the net effect of that workout on your physiology, which it does well. That makes workout tracking a want, not a necessity, in this stack. Garmin's training load helps me reverse-engineer what kinds of sessions, RPEs, and intensity patterns produce better recovery. But Oura is the one telling me whether the recovery actually happened.
Assessment
Wearables are tools, not oracles. The Oura Ring Gen 4 and Garmin Epix Pro Gen 2 together produce a data feed that would have been science fiction ten years ago, and most of it holds up under scrutiny.
But they share a single limitation: they measure the body. They cannot yet measure the brain. For athletes whose biggest performance limiter isn't tired muscles but cognitive capacity, that's the frontier that matters most.
The thing they can't do is read the report your brain is writing in the background, which only you can hear. Until a sensor changes that, the most important wearable you own is your own awareness of how your nervous system is actually performing.
Trust the trend, watch the sub-scores when something looks off, and give your brain a vote on the days it has something to say.
Sources
- DarkWolf Mission Log Metrics: December 2025 Report
- DarkWolf Mission Log Metrics: January 2026 Report
- DarkWolf Mission Log Metrics: February 2026 Report
- DarkWolf Mission Log Metrics: March 2026 Report (incl. Cookie memorial)
- DarkWolf Mission Log Metrics: Pre-Cycle Assessment (September 2025)
- DarkWolf Mission Log Metrics: Week 1 System Status (September 2025)
- de Zambotti et al. (2019). The Sleep of the Ring: Comparison of the OURA Sleep Tracker Against Polysomnography. Behavioral Sleep Medicine. PMC6095823
- Altini & Kinnunen (2021). The Promise of Sleep: A Multi-Sensor Approach for Accurate Sleep Stage Detection Using the Oura Ring. Sensors. PMC8271886 (Oura-funded)
- Chee et al. (2021). Multi-Night Validation of a Sleep Tracking Ring in Adolescents. Nature and Science of Sleep. PMC7894804 (independent)
- Svensson et al. (2024). Validity and reliability of the Oura Ring Gen3 with OSSA 2.0. Sleep Medicine. PubMed 38382312
- Khan et al. (2025). Systematic review and meta-analysis of Oura Ring sleep validation studies. OTO Open. PMC12602993
- Garmin Epix Pro Gen 2 specifications: Training Readiness, Body Battery, training load metrics (manufacturer)
- DarkWolf SITREP: private analytics dashboard pulling Oura + Garmin into a unified PoL (Pattern of Life) database with multi-metric anomaly detection